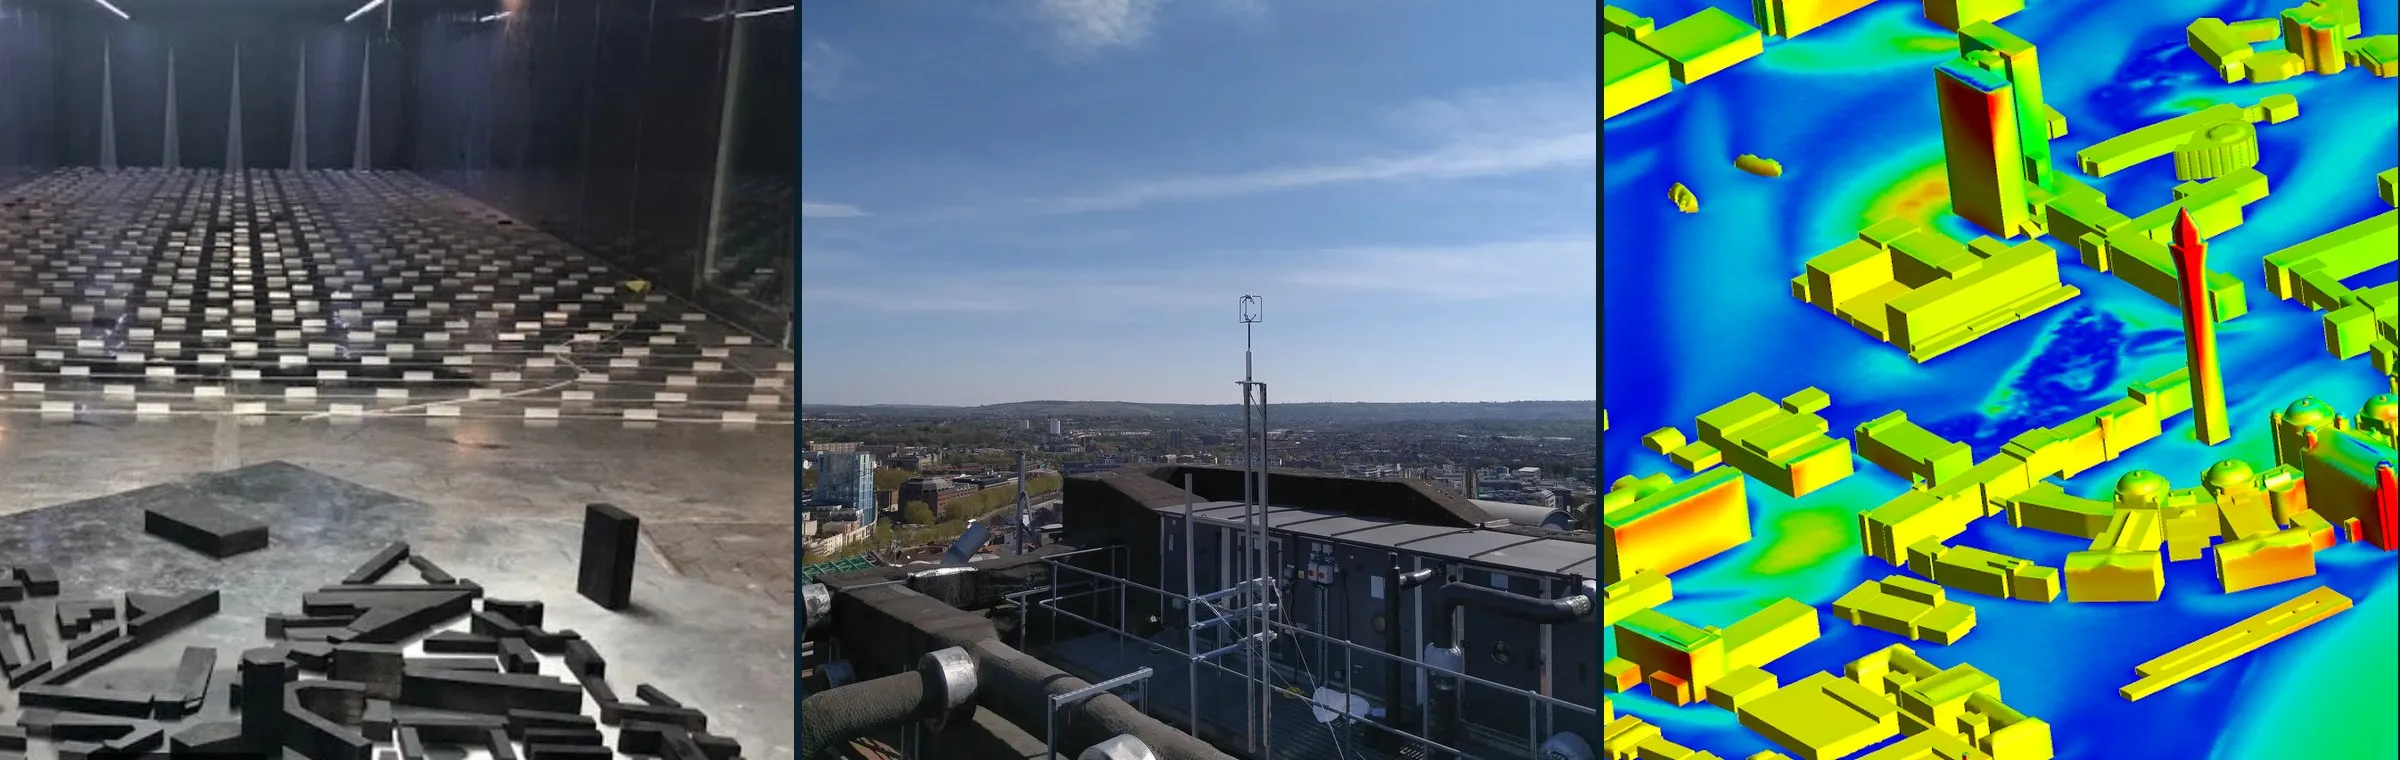
Urban data & tools
Measurements, simulation output, codes, geometries and benchmark cases for urban flow, gathered from the community and from open repositories (Zenodo, CEDA). Largest and most reusable resources first.
Browse by topic, method or place, or search everything below.
Filters
The 30 largest of 293 resources
Resources
-
Large-eddy simulations of turbulent airflow over 314 realistic urban neighbourhoods from 62 cities in 20 countries, with plan-area densities from 0.05 to 0.75 and several wind directions. Provides canopy-averaged statistics and flow fields, which are useful for canopy parameterisation, model validation and machine learning of urban wind.
Simulation Simulation outputGeometry LES
-
UrbanTALES: idealised building blocks
224 cases224 large-eddy simulations of flow over idealised building-block arrays. They systematically vary plan-area density (8 values, 0.0625 to 0.64), aligned and staggered layouts, 7 building-height distributions, and perpendicular or oblique wind. A parameter sweep for canopy parameterisation and model validation.
Simulation Simulation outputGeometry LES
-
High-resolution morphology, land cover and modelled UTCI thermal comfort data for seven European case study areas of CARMINE. Useful as urban geometry input and thermal comfort reference.
Collection · 9 parts Simulation GeometrySimulation output LES
-
The Architectural Institute of Japan (AIJ) urban wind environment benchmark suite: wind-tunnel and field data for cases A–M, from a single high-rise building and cube arrays to real districts such as Shinjuku and Niigata, many with STL geometry. Widely used to validate CFD for pedestrian-level wind and dispersion.
Collection · 12 parts Benchmark Lab MeasurementsCase setup Wind tunnel
-
Boundary-layer wind tunnel surface pressure measurements on parametric low-rise prismatic buildings. Useful for wind load studies and model validation.
Collection · 4 parts Lab Measurements Wind tunnel
-
Precursor LES turbulent inflow boundary conditions for AIJ actual-urban benchmark case.
Benchmark Simulation Simulation outputCase setup LES
-
Input data for PALM-4U large-eddy simulations of coupled atmospheric and subsurface energy fluxes in Berlin. Useful as a case setup.
Collection · 3 parts Simulation Case setupSimulation output LES
-
WindEEE wind-field and aerodynamic pressure data for a CAARC high-rise building in atmospheric boundary layer and downburst-like flows. Useful for wind-load validation.
Collection · 3 parts Lab Measurements Wind tunnel
-
Harmonised data from a street-level network of 42 automatic weather stations in Freiburg for 2022. Useful for intra-urban temperature and wind variability.
Collection · 27 parts Field Measurements
-
Non-stationary pressure and velocity measurements on a low-rise duo-pitch building model in the WindEEE Dome under ABL, downburst and combined winds. Useful for wind-load studies of non-synoptic winds.
Collection · 2 parts Lab Measurements Wind tunnel
-
urbisphere Doppler wind lidar: Paris
11 partsRaw Doppler wind lidar measurements at the Paris-region site Arboretum Vallee-aux-Loups from the urbisphere campaign. Useful for urban boundary-layer wind and turbulence profiles.
Collection · 11 parts Field Measurements
-
UT-GLOBUS global building height dataset for urban studies and modelling.
Tools & geometry Geometry
-
High-resolution synthetic 3D concentration fields of an air pollutant in urban environments. Useful for ML training and dispersion model comparison.
Simulation Simulation output ML / surrogate
-
Wind-tunnel tests of a selected area of Benidorm.
Collection · 2 parts Lab MeasurementsGeometry Wind tunnel
-
URANS cross-comparison on the AIJ Niigata case against wind-tunnel data.
Benchmark Simulation Simulation outputCase setup RANS
-
WRF-Chem concentration output for four land-use scenarios over the Barcelona metropolitan area during a heatwave. Useful for mesoscale urban air-quality and climate studies.
Simulation Simulation output Mesoscale model
-
Core dataset for testing regional climate models and urban schemes over Paris.
Simulation Case setupSimulation output Mesoscale model
-
Present and future daily air temperature and heat-stress indicator maps from UrbClim for 54 African cities.
Simulation Simulation output Mesoscale model
-
Turbulent inflow data of a rough atmospheric boundary layer for LES of Michelstadt, the semi-idealised Central European city model from the University of Hamburg wind-tunnel test cases (CEDVAL-LES), not the real town.
Simulation Simulation outputCase setup LES
-
Benchmark package for source inversion of urban pollution dispersion using building geometry and sparse sensors, including PPMLES/MUST summaries. Useful for testing inversion and sensing methods.
Benchmark Simulation Case setupSimulation output LESML / surrogate
-
Raw Doppler wind lidar measurements at Berlin Rothenburgstrasse from the urbisphere campaign. Useful for urban boundary-layer wind and turbulence profiles.
Collection · 16 parts Field Measurements
-
Supplementary files for LES of firebrand transport and deposition over 12 idealised cubical arrays.
Simulation Simulation outputSoftware & tools LES
-
Full-scale surface pressure and velocity measurements on the 6 m Silsoe cube in natural wind, with wind-tunnel comparisons. Used as the CWE2000 validation case for CFD; time series and compiled means and variances are available.
Benchmark Field MeasurementsCase setup Wind tunnel
-
European tiles of the GlobalBuildingAtlas, with building footprints and heights split into 0.1 degree tiles by country. Useful as geometry input for urban flow and microclimate modelling.
Tools & geometry Geometry
-
World Urban Morphological Parameters Open Dataset in COG and WRF-WPS formats.
Tools & geometry Geometry
-
City-scale 3D building and tree datasets for Glasgow from airborne LiDAR, in OBJ, shapefile and CityJSON formats. Useful as urban simulation geometry.
Collection · 2 parts Tools & geometry Geometry
-
Modified source code, simulation directories and postprocessing for multi-layer SURFEX-TEB coupling with Meso-NH for urban climate of high-rise cities. Useful for mesoscale urban modelling.
Simulation Software & toolsSimulation output Mesoscale model
-
PALM model inputs and source code for high-fidelity urban air quality sensitivity simulations. Useful for dispersion LES setups.
Simulation Case setupSoftware & tools LES
-
Global LCZ map at 100 m from earth observation. Usable as input for urban climate models and morphology classification.
Tools & geometry Geometry
-
LES output of an urban canopy and dense vegetated canopies over varying terrain complexity, for roughness-sublayer momentum statistics and TKE budgets.
Simulation Simulation output LES
Nothing matches these filters.
Browse all 293 resources by topic, method or place ↓
Know a dataset, code or benchmark we're missing? Email the portal contacts. The catalogue is refreshed monthly from Zenodo and CEDA; entries marked “Tags proposed by AI” have not yet been checked by hand.